Fast and simple loan to make rental bonds and moving expenses simple.
-
-
-
Resources
-
Company
If you’re looking for answers to any of the above questions, read our comprehensive article on household spending statistics in Australia for 2024.
On this page:
Looking for more fun (or not-so-fun) stats? Check out the following:
According to the latest Australian Bureau of Statistics (ABS) data, Australian household expenditure reached $1.19 trillion in 2023, which is just slightly under the $1.2 trillion spent in 2022.
‘Rent and other dwelling services’, such as mortgages, were by far the biggest household expense, with more than $254 billion of our national spending going towards keeping a roof over our heads. Up next were ‘recreation and culture’ ($123 billion), ‘food’ ($117 billion), ‘insurance and other services’ ($93 billion), and ‘hotels, cafes and restaurants’ ($88 billion).
You can see each of these categories in greater detail below.
These figures are very broad, however. The section below breaks our spending down to a household level, even looking at how much the average Aussie spends per day.
According to the Beforepay Cost of Living Index for February 2024, the average Aussie spends $60.78 per day - which is $1,763 per month - without important expenditures like rent and mortgage costs.
February’s daily spending was 4.6% higher than January’s ($58.12), and a post-holiday recovery in entertainment and leisure spending drove this increase.
This data, taken from the spending habits of over 163,000 Beforepay users, shows that groceries are our biggest everyday expense at an average of $15.07.
The report said that “Groceries saw the least amount of change month-on-month, dipping just 0.7% to $15.07 from $15.17.”
“Other notable increases include utilities, up 10.5% to $6.74 from $6.10, possibly in response to the changing seasons, and fitness and health, up 18.4% to $2.90 from $2.45, likely driven by New Year’s resolutions.”
The table below shows the average daily spend for Australians in eight everyday categories (excluding rent).
It’s worth noting how big of an expense rent and mortgages are. According to Domain’s December 2023 Rental Report, one-third of Australians who rent are paying an average of about $600 per week, or $31,200 per year.
We also calculated in our Cost of Living Comparison that the typical household with a mortgage is paying $3,713 per month, which is just under $45,000 per year!
However, for the above everyday expenses, the average Aussie spent about $60.39 per day in 2023, or $1,834 per month.
Household spending increased in all eight states and territories throughout 2023 and into 2024. According to the ABS’ Monthly Household Spending figures, the strongest increases were in:
Household spending differs significantly by state. For example, the ACT spent the most on health services in 2023, while Queensland spent the most on recreation and culture.
You can see a more detailed breakdown of what everyday items cost more in each state by reading the article below. But according to Numbeo, here’s what you can expect to pay for everyday household groceries, drinks and other meals as of February 2024, depending on the state/capital city you live in:
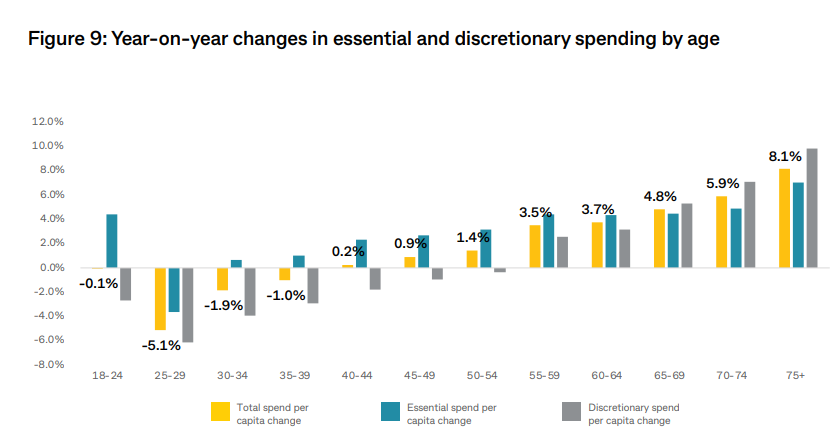
Data from Commonwealth Bank in late 2023 found the average Aussie spent $2,920 a month in the third quarter of 2023, with $1,473 going towards essential goods and services and $1,447 being discretionary (non-essential).
While most age groups are slowing down their spending on non-essentials, Commbank’s data shows that 25-29-year-olds are the only age group to reduce spending on essentials like food and medicine.
Among 25-to 29-year-olds, essential spending fell 3.7% to $955 per month, while discretionary spending dropped 6.2% to $1,300. Comparatively, Australians aged 65 and older increased their monthly essential spending by 5.5% to $1,518, and discretionary spending rose 7.2% to $1,176.

Clearly, younger age groups are spending far less than their older counterparts, who haven’t been hit as hard by cost-of-living pressures, interest rate rises, and inflation.
How are Australians’ pay cheques coping with all the rising expenses of the past few years? Not too well, although the outlook for income is improving.
In early 2023, Budget Direct’s Cost of Living survey found more Australians had felt their income had increased relative to living costs. Nearly half (48.5%) reported no change in their incomes, while 22.4% thought they had received a slight increase. That’s compared to 5.4%, who felt a ‘slight decrease’’ of 4.1% (decrease) and 3.4% (significant reduction in income).
| Significant decrease | 3.40% |
| Decrease | 4.10% |
| Slight decrease | 5.40% |
| No change | 48.50% |
| Slight increase | 22.40% |
| Increase | 8.40% |
| Significant Increase | 2.20% |
| N/A | 5.50%` |
However, more recent data from NAB for December 2023 paints a different picture. According to NAB, the net number of Aussies who said their incomes or pay increased in the December quarter fell to +1% (+9% in the September quarter).
Income stress also increased across all regions, age groups and genders, with more and more Aussies concerned about their pay.
Wages do look to have turned a corner. The latest official data from the ABS shows that the average weekly ordinary time earnings for full-time adults was $1,888.80 in November 2023. That’s an annual increase of 4.5% ($81 per week): the most substantial increase since May 2013.
“Average earnings growth was supported by increases in both the private sector, which rose by 4.4%, and public sector, up by 4.9%,” ABS head of labour statistics Bjorn Jarvis said.
That’s the equivalent of $98,217 a year (before tax). When factoring in other employees (part-time, contract work, etc.), that figure is $74,495 per year (+3.9% annually).
Workers in the mining industry remained the highest paid on average, at $2,952 a week for full-time employees ($153,504 per year). At the other end of the scale, accommodation and food services workers were the lowest paid, taking home just over $1,397 per week ($72,654 per year).
Men continued to earn more than women on average in 2023. The average weekly earnings for men were $2,183.30 (public) and $1,946.90 (private). For females, their weekly earnings were $1,956.80 (public) and $1,658.30 (private).
According to Mr Jarvis, the gender pay gap for weekly earnings fell to a new record low of 12%, down from 13% in May 2023.
“This was the third drop in the gender pay gap in a row, down to a new record low. This narrowing in the gap reflected stronger growth in average full-time earnings for women, 3.5% over the past six months, compared with 2.3% for men,” he said.
“Annual growth was also more pronounced for women at 5.5%, compared with 4.0% for men.”
Unsurprisingly, incomes were highest in states/territories where all the mining and public service jobs are. Average weekly ordinary time earnings for full-time workers were highest in Western Australia ($2,108) and the Australian Capital Territory ($2,080) and lowest in Tasmania ($1,670) and South Australia ($1,735).
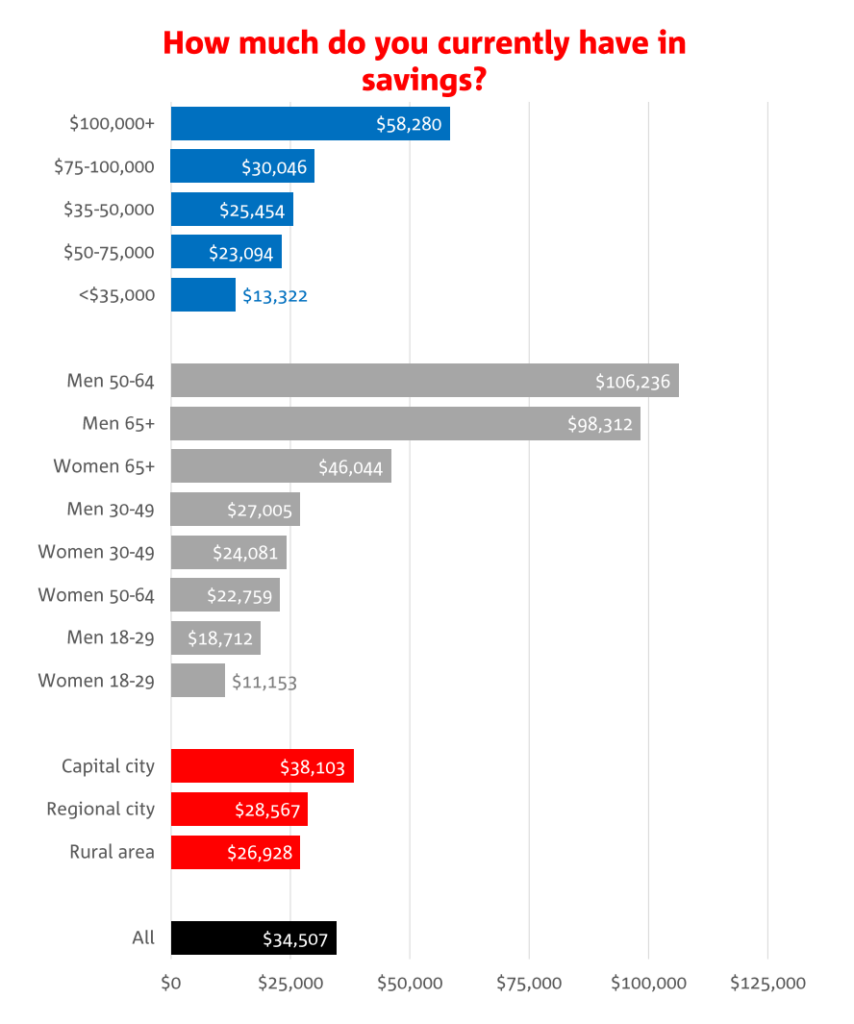
According to the most recent, complete annual data from NAB in December 2022, the average Australian had $34,507 stashed away in savings. Finder's Consumer Sentiment Tracker data for May - June 2023, on the other hand, found a similar figure at $31,179.
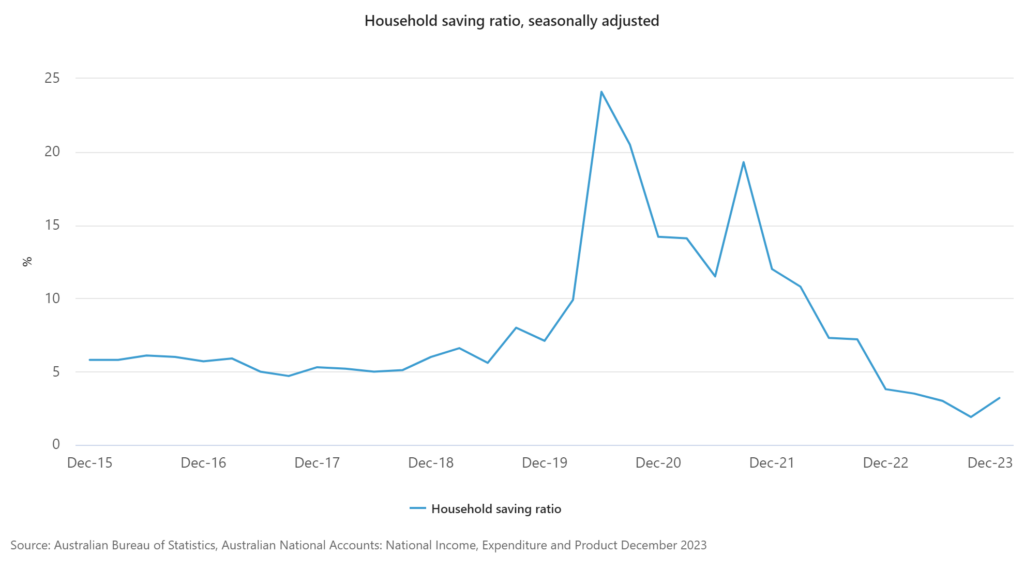
Since this data is from late 2022, however, the average savings level now is likely to have gone in a different direction. Given that the household savings ratio fell from 3.8% to just 1.1% at that time (ABS), that direction will probably be down. As of December 2023, households are saving 3.2% of their income due to reduced spending on non-essentials.

For example, the same NAB survey from nine months later (September 2023) revealed that savings were under pressure in 2023. Savings aspirations among Australians remained high, with the overall number trying to save rising to 77% in Q3 (75% in Q2) and slightly above average (76%).
However, far more Australians reported a net decrease in their savings (-29%) compared to those who reported an increase (-8%); the fourth consecutive quarter this has happened.
Compare the Market also reported that almost half 49%) of Aussies were saving less than usual last year, with over a quarter of people dipping into their savings to pay for necessities.
By age and gender, men typically had more savings than women across all age groups. According to NAB, average savings were highest among men aged 50-64 ($106,236) and lowest among women aged 18-29 ($11,143):
| Age | Average Savings - Men | Average Savings - Women |
|---|---|---|
| 18-29 | $18,712 | $11,153 |
| 30-49 | $27,005 | $24,081 |
| 50-64 | $106,236 | $22,759 |
| 65+ | $98,312 | $46,044 |
| Source: NAB, 2022 |
Finder did a similar breakdown by generation and found similar trends for average savings. Even among Gen Z, the youngest age group, males had higher average savings than females:
| Age | Average Savings - Men | Average Savings - Women |
|---|---|---|
| 18-26 | $10,835 | $8,837 |
| 27-41 | $18,716 | $14,632 |
| 42-61 | $58,436 | $21,273 |
| 61+ | $58,691 | $46,695 |
| Source: Finder, 2023 |
Unsurprisingly, Aussies on higher incomes tend to save more. The more you earn, the more you tend to have to put away after your expenses have been taken care of.
Savings were lowest in the lowest-income group ($13,322) and highest in the highest-income group ($58,280). The highest income group, $100,000+ annually, had more than double the average savings of the following income bracket ($30,046).

Savings rates can also vary significantly by state, reflecting the diverse economic conditions, cost of living, and average income levels across Australia. By region, savings were highest in capital cities ($38,103) and lowest in rural areas ($26,928). Smaller regional cities see an average household savings of $28,567 (NAB).
There are plenty of small and large changes you can make to save money and cut down on household spending in 2024. For example, Finder found that 41% of people had made a financial blunder in the past 12 months, such as forgetting to cancel a free trial (17%, letting a gift card expire (14%), and going over data limits (13%).
These are your small, everyday spending pitfalls. The more significant items include not comparing and switching plans on things like health insurance, car insurance or energy bills. According to Compare the Market's report, only 17% of Australians do this on a regular basis.
We could spend all day talking about tips to increase your savings. Instead, why don’t you hop over to our mega-article on 75 everyday ways to save money in 2024? Here, you’ll find everything from the top ways to cut down on your energy use to how the supermarkets use psychology to trick you into spending more!