Fast and simple loan to make rental bonds and moving expenses simple.
-
-
-
Resources
-
Company
But which city has the most affordable rent? Where is it cheapest to fill up a tank of fuel?
In this detailed comparison of Australia’s different states and capital cities, we delve into the heart of the country's cost-of-living crisis, examining key factors such as inflation, mortgages, rent, groceries, fuel, transport, electricity, and more.
Whether you're considering a move, seeking to optimise your expenses, or are curious about how your state compares to the rest, this article should tell you what you want to know.
On this page:
Inflation started to fall in late 2023, indicating that the worst of the cost of living crisis may be behind us. That’s according to the latest Australian Bureau of Statistics (ABS) data for December 2023, with Michelle Marquardt, ABS head of prices statistics, saying:
“The CPI rose 0.6% in the December quarter, lower than the 1.2% rise in the September 2023 quarter. This was the smallest quarterly rise since the March 2021 quarter.
“While prices continued to rise for most goods and services, annual CPI inflation has fallen from a peak of 7.% in December 2022 to 4.1% in December 2023.”
Only three capital cities in Australia saw an increase in prices bigger than this 4.1% average: Brisbane, Sydney, and Perth. The latter saw the largest annual inflation rate at 4.8% overall.
Meanwhile, the smallest was Hobart, at a 3.3% rise.
| % CPI Increase | |
| Capital City | Dec Qtr 2022 to Dec Qtr 2023 |
| Sydney | 4.2% |
| Melbourne | 3.8% |
| Brisbane | 4.2% |
| Adelaide | 4.8% |
| Perth | 3.6% |
| Hobart | 3.3% |
| Darwin | 3.9% |
| Canberra | 3.7% |
| Weighted average of eight capital cities | 4.1% |
Overall, the most significant contributors to inflation across Australia in 2023 were housing (+6.1%), alcohol and tobacco (+6.6%), insurance and financial services (+8.1%), and food (+4.5%).
As of January 2024, Sydney (unexpectedly) has the highest median house price at more than $1.1 million, according to CoreLogic’s latest report. To be exact, the median Sydney dwelling value is $1,122,430: a 24.2% rise since the onset of the COVID-19 pandemic in 2020!
In comparison, property in Darwin is the cheapest, with a median value of $501,520.
The national median value for a home is $759,437, which is 31.6% higher than in the same month in 2020.
The table below shows the median property value of each capital city as of January 2024:
In December 2023, the average mortgage size in Australia rose 2.6% to a new record high of $624,000! Note that’s the average mortgage size: with a 20% deposit, a house with that average loan amount would cost around $750,000.
Unsurprisingly, the state with the highest home value in its capital - NSW - also has the highest average loan amount, with the typical borrower taking out a whopping $785,000 in late 2023.
The ACT and Victoria are second and third, respectively, with average loan amounts of $622,000 and $613,000. The lowest average loan amount lies in The NT, where new mortgage holders borrowed $437,500.
The graph below shows the average mortgage size in each state as of January 2024:
To work out which state has the highest monthly home loan repayments, we’ll use the median home value data above and, assuming a 20% deposit, calculate their repayments using ASIC’s mortgage repayment calculator.
We’ll assume a 30-year principal and interest mortgage with an interest rate of 6.18% p.a., which is the average owner-occupied interest rate as of November 2023, according to the Reserve Bank of Australia.
Sydney again loses out here, with an average monthly mortgage repayment of nearly $5,500. That’s well clear of 2nd placed Canberra ($4,100 monthly loan repayments).
See the table below for a complete look at what the average homeowner pays each month as of 2024.
Given that roughly one-third (31%) of households rent in Australia, it’s just as crucial to know where the cost of living is most demanding for renters as well as homeowners.
According to Domain’s December 2023 Rental Report, ‘perilous’ rental conditions saw a record-low vacancy rate and the longest continuous stretch of rising rents on record.
“At the end of 2023, asking rents sat at record highs across the combined capitals and all cities, apart from Canberra houses and Darwin and Hobart unit rents,” the report said.
“Despite the records and consecutive rises, extreme rent hikes are losing traction as rental gains continue to slow across most of the capital cities.
“The rental market may have turned a corner over the December quarter, as house rents across the combined capitals held steady for the first time in almost three years, ending the record-breaking stretch of 10 consecutive quarterly increases.”
The table below shows every capital city’s median rental price for both houses and units as of December 2023 and compares it to the same time two years prior.
As you can see, rents across our capital cities have increased by just about one-third in that short time! Sydney once again claims the title of most expensive city, with median asking rents sitting at $705 per week. That’s more than $100 above the average!
For those looking to find a cheaper rental, Adelaide and Hobart would be your best bet, with weekly asking rents of $505 and $500, respectively.
| Capital City | DEC-2023 | DEC-2021 | Two-Year Growth |
|---|---|---|---|
| Sydney | $705 | $533 | 32.27% |
| Melbourne | $535 | $410 | 30.49% |
| Brisbane | $580 | $450 | 28.89% |
| Canberra | $620 | $600 | 3.33% |
| Adelaide | $505 | $400 | 26.25% |
| Perth | $570 | $425 | 34.12% |
| Combined Capitals | $600 | $453 | 32.45% |
Rental (or housing) stress is generally defined as a household that spends 30% or more of its gross income on housing costs. In 2019–20, 10.5% of households spent more than 30% to 50% of gross income on housing costs, and 5.7% of households spent 50% or more.
Annual rental affordability data by National Shelter and SGS Economics & Planning for 2023 found that rental stress and affordability had gotten worse in every state and territory. Rental affordability has also worsened in all major Australian cities and regions except for Hobart and Canberra.
Regional Queensland is now the least affordable place of all regions and capital cities, with average rentals at $553 per week, or 30% of the average income. New South Wales had the sharpest decline in affordability, now at 29% of household income.
According to a 2024 survey by InfoChoice, over three-quarters (77.6%) of renters in Australia say they are stressed about rent to some extent. Victorian renters were the most rent-stressed (81.2%), followed by Tasmania (79.7%) and WA (79%).
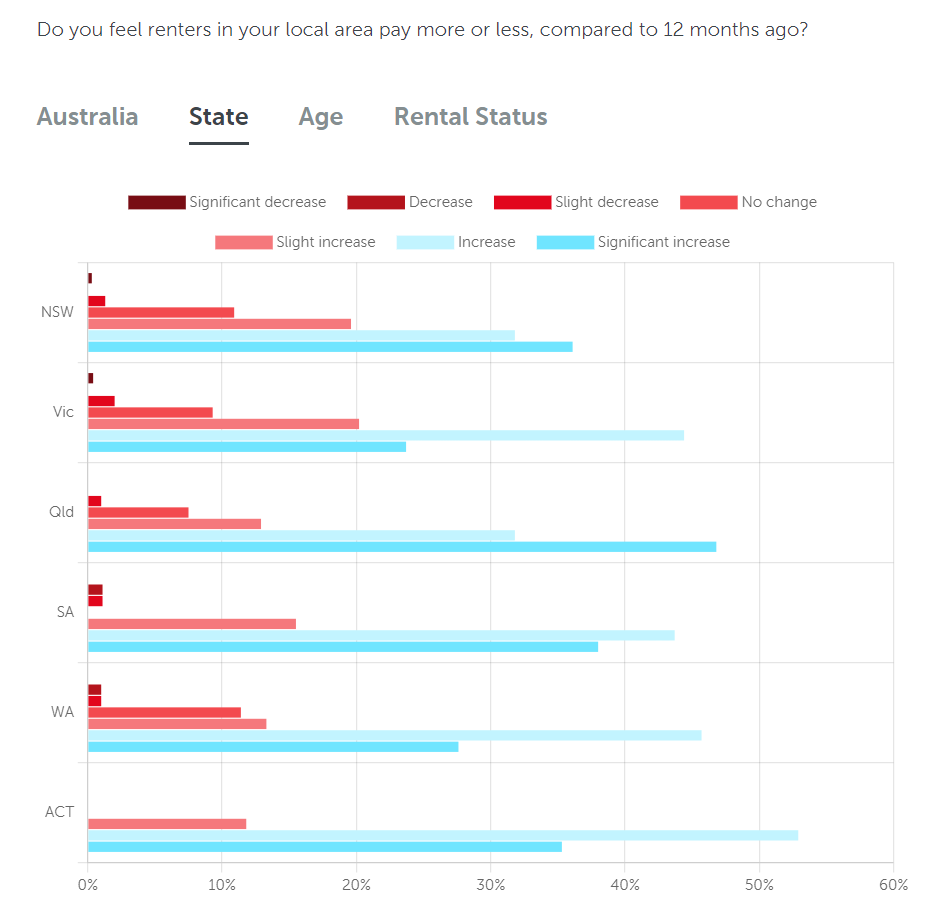
Most Australians feel there’s been an increase in the cost of monthly rent over the past 12 months, according to Budget Direct. As many as 34.3% and 37.9% of people had experienced either a ‘significant increase’ or an increase in rent, respectively, in 2023, while only 1.7% had some kind of rent decrease in total.
Broken down by state, Queensland has been feeling the cost of living hike more than other states, with 47% saying they’d noticed a significant hike in rent prices.
More than half of ACT residents felt they had seen an overall increase in their rent. In NSW, rent increases were reported by 32%, while another 36% felt their increase was ‘significant’.

Meanwhile, CoreLogic reported in mid-2023 that more than 90% of Australian rental markets had seen an increase in rent over the previous 12 months. Almost two-thirds of unit suburbs recorded an annual rent increase of 10% or more, as did more than one-third of house markets.
Literally every single suburb analysed in Adelaide, Perth, and Regional Western Australia experienced a rent increase in 2023. Every one!
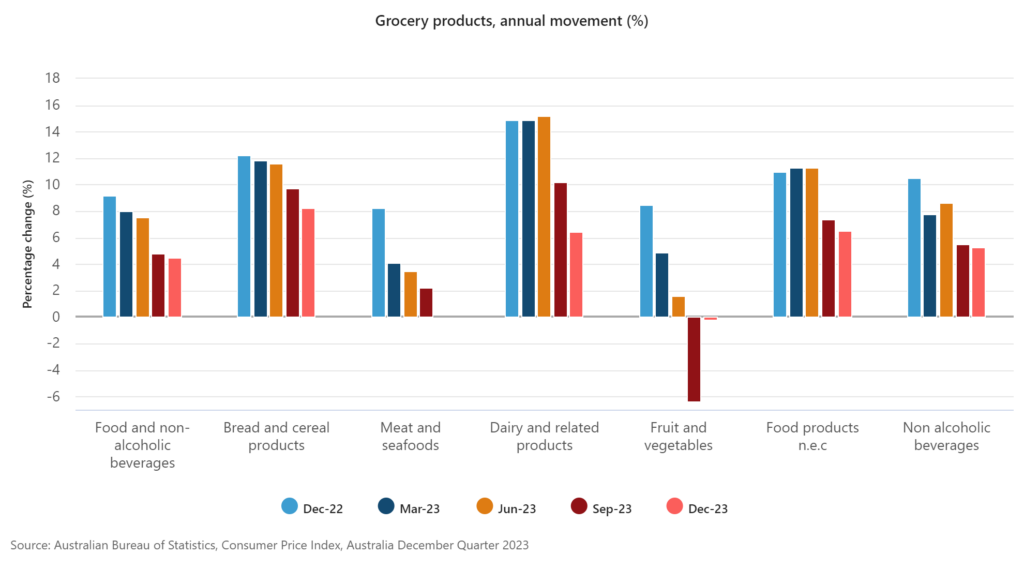
Continual price hikes on groceries have been a concern for the majority of Aussies for years now, so much so that the major supermarket chains are being investigated for price gouging.

While the rate of grocery and food price increases slowed throughout 2023, easing from a peak of 9.2% in December 2022 to 4.5% a year later, many Australians are still concerned.
Compare the Market research identified groceries as the most significant household financial burden (32%) in 2023, ahead of mortgage repayments (24.1%), rent (15.2%) and energy costs (7.7%). The average weekly grocery spend for households jumped from $170 in September 2021 to just shy of $200 mid-way through 2023.
Nearly half (48%) of the country is worried or anxious about getting consistent access to adequate food (Foodbank), and a similar number felt that grocery prices had risen ‘significantly’ over the past 12 months (Budget Direct).
According to Numbeo, here’s what you can expect to pay for everyday household groceries, drinks and other meals as of February 2024:
Sydney has the most expensive cheese, costing nearly $4 more than the national average. However, Canberra and Adelaide seem to have the most expensive groceries overall, with 10 of the 14 categories measured being the most expensive in these two cities.
Adelaide can claim the most expensive coffee at $6 for a regular cappuccino, while Canberra’s $13.50 Pint of beer is the least Australian.
Brisbane and Melbourne, on the other hand, appear to claim cheaper groceries than the average city.
Another everyday necessity, fuel prices have risen significantly, according to 40% of people (Budget Direct). While this is less than the 77% who said the same in 2022, just over 10% of people feel there has been either no change or a decrease in fuel prices.
The official stats don’t lie: fuel prices are starting to fall. Average unleaded fuel prices peaked at $2.13 per litre in October 2023 before falling to a low of $1.78 in December. According to the latest Australian Automobile Association’s (AAA) Transport Affordability Index, the average Australian household spent roughly $102 per week on fuel, which is nearly 25% of weekly transport costs!
Sydney’s fuel costs were once again the most expensive among the capital cities at $102.88 per week, while Perth was the most affordable capital for fuel at an average of $97.48.
But fuel is much costlier for regional Australians. Bunbury in WA claims the priciest fuel in the country, setting its residents back over $123 per week!
| Rank | City | Weekly fuel cost | Change from the previous quarter |
| 1 | Sydney | $102.88 | +$8.98 |
| 2 | Brisbane | $101.70 | +$6.18 |
| 3 | Hobart | $101.40 | $6.48 |
| 4 | Canberra | $101 | +$5.85 |
| 5 | Melbourne | $100.71 | +$6.96 |
| 6 | Darwin | $99.35 | +$5.35 |
| 7 | Perth | $97.79 | +$7.33 |
| 8 | Adelaide | $97.48 | +$6.27 |
| Capital average | - | $100.29 | +$6.67 |
| Rank | City | Weekly fuel cost | Change from the previous quarter |
| 1 | Bunbury | $123.22 | +$6.80 |
| 2 | Geelong | $120.98 | +$6.76 |
| 3 | Launceston | $115.47 | +$7.43 |
| 4 | Mount Gambier | $109.90 | +$6.77 |
| 5 | Alice Springs | $108.73 | +$5.71 |
| 6 | Townsville | $77.90 | +$4.99 |
| 7 | Wagga Wagga | $68.05 | +$4.69 |
| Regional average | - | $103.46 | +$6.16 |
Household bills such as energy and gas are among the top concerns still in 2024. The inflation figures show that electricity prices rose 6.9% in the 12 months to December 2023, down from the increase of 14.5% in the 12 months to September.
According to the Energy Consumer Sentiment Survey (ECSS), just 54% of households are satisfied with their electricity plan’s value for money. For gas bills, that number falls to just 41%.
But which state pays the most for energy? Find out below!
According to Canstar Blue, the following table contains the average quarterly electricity bill in each Australian state/territory as of January 2024. Tasmania, South Australia, and New South Wales had the highest bills, while Western Australia had the cheapest.
The same data from Canstar Blue isn’t quite as recent for gas bills, so we’ve instead gone to Finder, which has more up-to-date gas figures as of February 2024. Based on the table below, New South Wales pays the most for gas, with WA residents again winning out in the cheap energy stakes.
There’s no definitive answer to this question, as the ‘best state’ from a cost-of-living perspective could be completely different for each person.
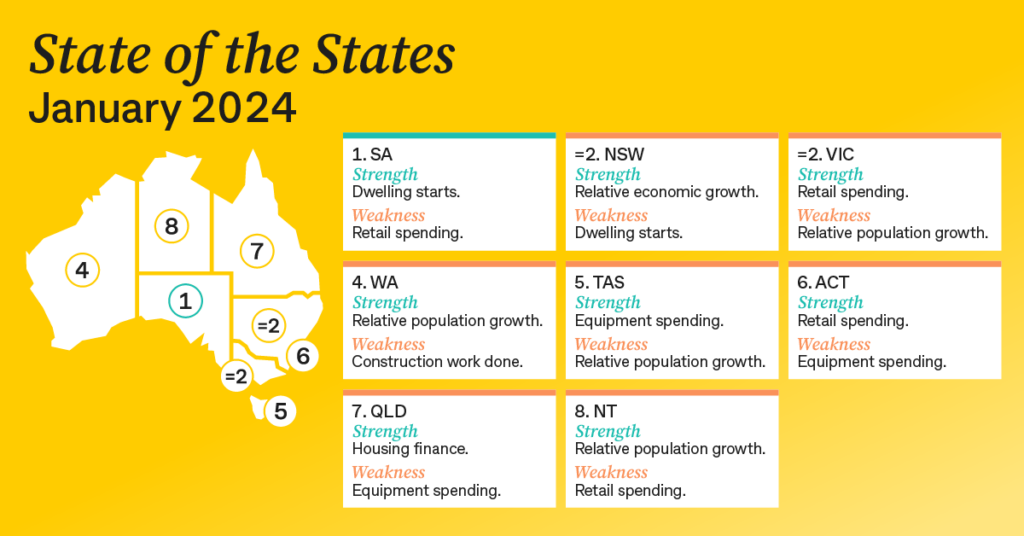
Each month, Commonwealth Bank releases a ‘State of the States’ report, which ranks each state and territory on a number of criteria. In January 2024, South Australia was the number one state for the very first time, jumping ahead of Victoria. SA took out the top spot on four of the eight key economic indicators – real economic growth, unemployment, construction work and dwelling starts.

But this is more of a high-level ranking. For the average person, day-to-day affordability is more of a concern. While this is harder to measure, Expatisan’s Cost of Living Price Index places Sydney at the very top—surprise surprise.
Expatisan’s Price Index assigns each city a number based on its affordability, with 100 being the central reference number, aka the average. With a Price Index of 177, Sydney is 77% more expensive than the average global city!
| Ranking | City | Price Index |
| 1st | Sydney | 177 |
| 2nd | Melbourne | 163 |
| 3rd | Perth | 149 |
| 4th | Brisbane | 143 |
| 5th | Cairns | 120 |
| 6th | Newcastle, Australia | 113 |
| 7th | Wollongong | 108 |
| 8th | Darwin | 107 |
| 9th | Townsville | 101 |
In the face of Australia's persistent cost of living crisis, finding ways to stretch your dollar further has never been more crucial. While it can be tough reading, remember that most of the figures in this article are averages only: there’s plenty of room to save on each of these critical expenses if you know how.
If you want some inspiration on ways to save on everyday household bills and costs, we’ve prepared a list of quite a few here. Seventy-five of them, in fact!
Our article on ways to save money in 2024 covers everything from renting out your car to consolidating your debts, switching insurers, and plain old budgeting apps. So check it out and start easing the pressure on yourself.
Check out our fast online personal loans, starting from $3,000 up to a maximum of $25,000. Apply in just 5-12 minutes1 and get a same-day turnaround on your application2: you can then start improving your credit score and tracking its progress for free in the Better Credit mobile app.
Check if you qualify for one of our loans without impacting your credit score today using the button below.