Rental Bond Loans
Fast and simple loan to make rental bonds and moving expenses simple.

Explore our comprehensive guide on Australian household debt statistics in 2025, including home loans, credit cards, personal loans and BNPL (Buy Now, Pay Later) debt.
On this page:
*Latest household debt statistics from 2021-2024.
According to the OECD, household debt is “all liabilities of households that require payments of interest or principal to creditors at fixed dates in the future. A less mouthy definition would just be loans and consumer credit accounts you still owe, such as credit cards.
Not all debts are bad. Debts can be separated into ‘good’ and ‘bad’ categories.
Good debt is characterised by its potential to increase your net worth or generate long-term income, with common examples being mortgages to buy a house, student loans and investment loans.
Bad debt, on the other hand, involves borrowing to purchase depreciating assets or consumption items that lose value quickly and do not generate long-term income. Examples of bad debt usually include credit cards, car loans and payday loans.
Good debts can also become bad debts. If you end up in mortgage stress, for example, and pay upwards of 30% of your income just on your repayments, that good debt could soon become a bad debt.
Debt is extremely common in Australia. As we’ll explain in greater detail further down, Australia has some of the highest levels of household debt in the world!
According to NAB’s Australian Wellbeing Survey for Q4 2024, credit card debt is still the most widely held debt by Australians, with 36% having debt on at least one credit card. Home loan debt was next most common and held by about 1 in 4 (28%) Australians overall; 23% carried BNPL debt, and around 15% owed money on a personal loan.
| Type of Debt | % of Australians |
|---|---|
| Credit card debt | 36% |
| Home loan | 28% |
| Buy now, pay later (BNPL) | 23% |
| Personal loan | 15% |
| Loan from family & friends | 16% |
| Investment loan | 8% |
| Payday loan | 5% |
There isn’t too much of a gender divide in terms of who holds each type of debt. Men were slightly more likely than women (40% vs 33%) to hold credit card debt, while more women (28%) had an active mortgage than men (27%). Women were also more likely to hold BNPL debt compared to men (26% vs 19%).
| Type of Debt | % of Men | % of Women |
|---|---|---|
| Credit card debt | 40% | 33% |
| Home loan | 27% | 28% |
| Buy now, pay later (BNPL) | 19% | 26% |
| Personal loan | 15% | 15% |
| Loan from family & friends | 14% | 17% |
| Investment loan | 9% | 7% |
| Payday loan | 5% | 6% |
There are more pronounced differences in the types of debts held by different age groups. Unsurprisingly, the youngest age group (18-29-year-olds) are the least likely to have an active mortgage at just 23%. Even fewer 65+ Australians have a mortgage (9%), as they’re the most likely generation to have fully repaid their mortgages.
| Type of Debt | % of 18-29 | % of 30-49s | % of 50-64s | % of 65+ |
|---|---|---|---|---|
| Credit card debt | 22% | 40% | 41% | 39% |
| Home loan | 23% | 41% | 29% | 9% |
| Buy now, pay later (BNPL) | 28% | 29% | 21% | 8% |
| Personal loan | 25% | 20% | 9% | 3% |
| Loan from family & friends | 23% | 21% | 11% | 4% |
| Investment loan | 8% | 12% | 7% | 2% |
| Payday loan | 8% | 7% | 3% | 1% |
Higher-income Australians– defined by NAB as earning $100,000 or more annually– have more ‘good debts’, with 43% having an active mortgage compared to just 8% for lower-income Australians. This makes sense when you consider the requirements banks have for servicing a mortgage when assessing an application, as well as the challenge of saving up for a deposit in the first place.
Higher-income earners also take out more investment loans (15% vs. 2%), and have more credit card debt than lower-income earners (43% vs. 23%).
| Type of Debt | Lower-Income | Higher-Income |
|---|---|---|
| Credit card debt | 23% | 43% |
| Home loan | 8% | 43% |
| Buy now, pay later (BNPL) | 23% | 24% |
| Personal loan | 11% | 19% |
| Loan from family & friends | 21% | 13% |
| Investment loan | 2% | 15% |
| Payday loan | 7% | 5% |
According to the most recent census data, roughly one-third (35%) of Australians have an active home loan, and given their size, these loans account for the majority of Australian household debt. In the December 2024 quarter alone, more than $87 billion worth of new home loans were settled!
NAB's data shows the average home loan debt in Australia is $327,514 (up from $293,705 the year before).
The table below shows how the size of the average home loan debt varies between age, gender and income:
| Demographic | Average Outstanding Home Loan Debt |
|---|---|
| 18-29 | $328,504 |
| 30-49 | $396,581 |
| 50-64 | $237,092 |
| 65+ | $127,838 |
| Men | $356,011 |
| Women | $302,143 |
| Lower-income | $112,638 |
| Higher-income | $401,245 |
There’s a difference between the average home loan size and the balance owed. As you pay off a home loan over time, the outstanding balance decreases and your equity grows. While the average outstanding home loan balance as of December 2024 may have been just under $330,0000, the size of new home loans funded is much higher.
In December 2024, the average mortgage size in Australia was $666,000! The state with the highest home value in its capital, NSW, also has the highest average loan amount, with the typical borrower taking out a whopping $811,000.
The graph below shows the average mortgage size in each state as of December 2024:
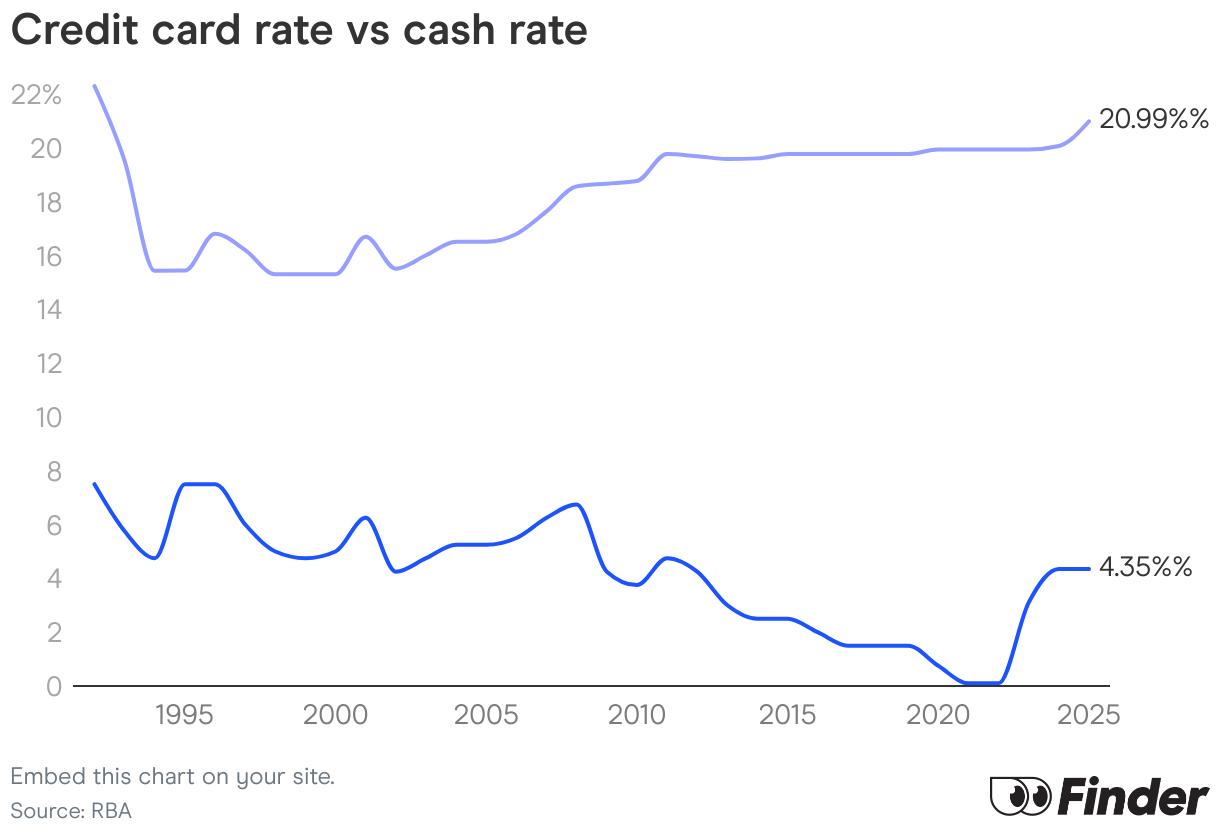
Home loan interest rates have increased significantly over the past several years in Australia, thanks to over a dozen cash rate increases by the Reserve Bank (RBA) since May 2022, dropping only slightly since February 2025. In that time, the cash rate has gone from a record low of 0.10% to 3.85% (as of July, 2025), and interest rates on mortgages have generally followed suit.
As of July 2025, the average interest rate on outstanding owner-occupier home loans was 5.8% p.a. Property investors paid even more (6% p.a).
As the graph below shows, the average owner-occupied interest rate before the cash rate began to rise in May 2022 was a mere 2.9% p.a.
As mentioned above, credit cards are the most popular type of debt in Australia, used by more than one-third of the country. However, they’re a lot less popular than they used to be.
The latest official credit card stats from the RBA show 16.8 million active credit cards are currently in circulation (July 2025). This is down 1.87% from the previous year (July 2024) and down 29.26% from the previous decade (July 2015).
Comparatively, debit cards are much more popular, with nearly 45 million currently used as of July 2025 (up 6.49% from the previous year).
Interested in learning more about Credit Card & Debit Card statistics? Click Here
According to NAB’s data, the average balance on each active credit card is $3,255 as of December 2024.
Average credit card balances were higher among men ($3,416) than women ($3,112), while higher-income earners were more likely to spend big on their credit cards compared to lower-income earners:
| Demographic | Average Outstanding Credit Card Balance |
|---|---|
| 18-29 | $2,105 |
| 30-49 | $4,592 |
| 50-64 | $3,167 |
| 65+ | $2,350 |
| Men | $3,416 |
| Women | $3,112 |
| Lower-income | $2,388 |
| Higher-income | $4,152 |
When you put all that personal credit card debt together, the balance accruing interest across Australia totals almost $20 billion! The total balances outstanding on credit and charge cards is $42 billion (as of July 2025). While those figures are a lot, they’re much less than pre-covid levels when the balance accruing interest was $27.9 billion, and the total monthly card debt was $46.5 billion.
According to Finder, interest rates on ‘standard’ credit cards are 20.99% p.a, as of January 2025. Remember: credit card rates can vary significantly depending on a number of factors.
Personal loans are on the rise in Australia. The latest ABS data for March 2025 found the value of funded personal loans increased by nearly 13% over 12 months, with $8.4 billion in loans settled in that quarter alone.
The total value of outstanding personal loans (that is, loans that still need to be repaid) spiked to an all-time high of $170.7 billion in July 2019. The latest Finder research says the total value of personal loans now sits at $153 billion – lower than pre-pandemic levels.
Interested in learning more about Personal Loan statistics? Click Here
The average personal loan debt as of December 2024 was $11,848, up from $10,925 the year before. Here’s the average personal loan debt broken down further by age, gender and income:
| Demographic | Average Outstanding Personal Loan Balance |
|---|---|
| 18-29 | $10,618 |
| 30-49 | $14,439 |
| 50-64 | $8,936 |
| 65+ | $8,766 |
| Men | $12,404 |
| Women | $11,389 |
| Lower-income | $4,905 |
| Higher-income | $14,869 |
Payday loans are designed to provide temporary finance solutions over a shorter period and for smaller amounts, usually up to $2,000. While they aren’t allowed to charge interest, ASIC states that they commonly charge the following high fees:
The average payday loan debt as of December 2024 was $1,337, which is a lot given the extremely high charges these loans can come with.
Gen Z Australians (Ages 18-29) had the highest average payday loan debt at $1,548. Senior Australians over 65, on the other hand, owed on average less than $180.
| Demographic | Average Payday Loan Debt |
|---|---|
| 18-29 | $997 |
| 30-49 | $685 |
| 50-64 | $716 |
| 65+ | $250 |
| Men | $613 |
| Women | $1,029 |
| Lower-income | $413 |
| Higher-income | $678 |
If you’re struggling with money or debts, you can call the free National Debt Helpline on 1800 007 007 (Monday to Friday). Aboriginal and Torres Strait Islander peoples can also contact the free Mob Strong Debt Helpline on 1800 808 488.
ASIC MoneySmart also recommends doing the following:
Buy Now, Pay Later (BNPL) services allow you to delay the full payment of a purchase. However, unlike a credit card, each purchase will be split into four or more equal slices and repaid in instalments, often fortnightly. BNPL platforms like Afterpay or Zip also don’t tend to charge interest; instead, late payment fees for missed payments are charged, commonly around $7-$15 each time.
Mozo data shows the average BNPL user spends $2,208 annually, or $184 per month. As of June 2025, BNPL has been classified as a form of credit by the Australian Government, which means responsible lending obligations for lenders and credit checks and further protections for customers.
NAB’s research shows more than 1 in 5 (23%) of Australians had BNPL debt as of December 2024. BNPL was the most widely held debt in the 18-29 group (28%) and more common among women than men (26% versus 19%).
Read More: BNPL vs Personal Loans
According to NAB’s report, the average outstanding BNPL debt as of December 2024 was $798.
While women are more likely than men to engage with BNPL platforms, men are more likely to spend higher with an average outstanding balance of $882 compared to $743.
By age, 30-49-year-olds carry the highest BNPL debts, followed closely by 50-64-year-olds. NAB’s report shows an average BNPL debt of $971 and $851 for these groups respectively. Those 65 and up owe the lowest average at $633.
Higher-income groups have a higher average debt ($1,071) than those on lower incomes ($609).
Average BNPL Debts by Demographic:
| Demographic | Average Outstanding Balance (Debt) |
|---|---|
| 18-29 | $571 |
| 30-49 | $971 |
| 50-64 | $851 |
| 65+ | $633 |
| Men | $882 |
| Women | $743 |
| Lower-income | $609 |
| Higher-income | $1,1071 |
A December 2023 survey by Finder found that just under half (49.11%) of Aussies have never used a BNPL platform. Of those who have, Afterpay is the most popular, used by more than 37% of Australians.
How many Australians have used a buy now pay later service?
| Platform | % Used at Least Once |
|---|---|
| None | 49.11% |
| Afterpay | 37.2% |
| PayPal Pay in 4 | 17.13% |
| Zip | 16.93% |
| Humm | 4.82% |
| Openpay (no longer available) | 4.23% |
| Klarna | 3.94% |
| Other | 2.66% |
| Bundll (owned by Humm) | 0.49% |
Australia has some of the highest levels of household debt in the world. As of December 2022 (ABS), the average Australian household had a debt of $261,492, which is around $2.6 trillion (with a T) nationally. That’s an increase of 7.3% from the previous year.
According to the OECD, the average household debt is 215% (or 2.1x) of net disposable income. Essentially, we owe twice as much as we earn!
Compared to the other OECD countries (aka leading economies), Australia’s household debt ratio is the fourth highest in the world. Only Norway, the Netherlands and Switzerland are ahead of us, at 247%, 236% and 227% respectively.
Denmark follows closely behind us at 212%.
Managing multiple debts across various lenders can be not only overwhelming but also financially draining. That’s why we offer debt consolidation loans to help.
By consolidating your debts into a single, manageable loan, you could not only streamline your repayments but potentially lower your overall interest rates and monthly payments as well.
Take the first step towards regaining control of your finances by exploring our debt consolidation solutions today.